
Is your solar system producing enough each day?
A daily kWh number means little until you compare it with the panel size, weather, controller limit, battery charge state and loads running at the same time.
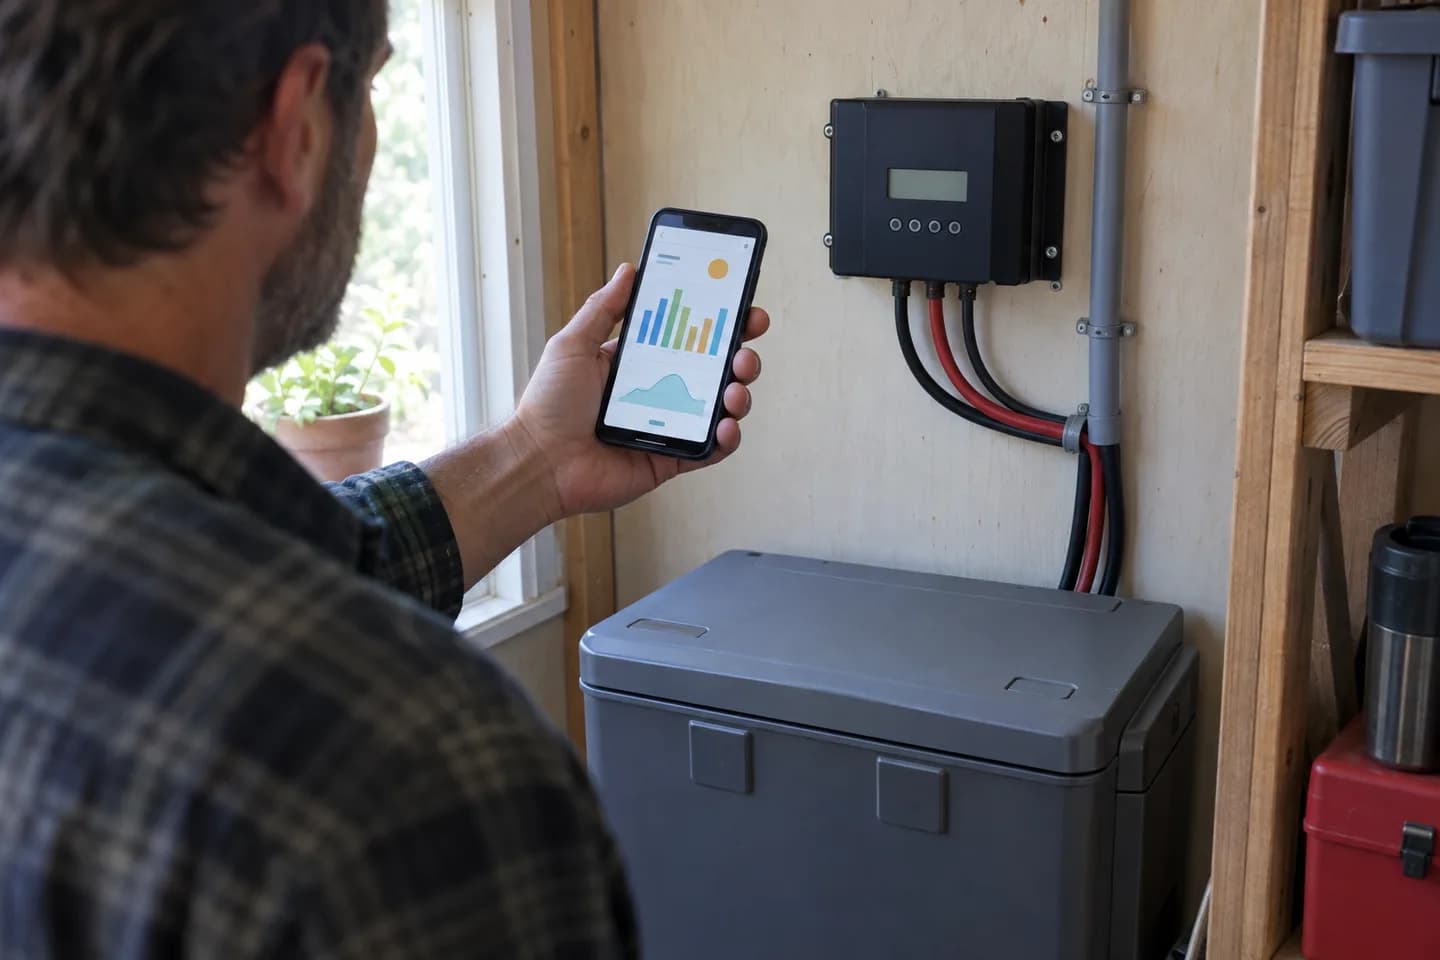
Open a solar app around lunchtime and it may show 180W. Look again after sunset and the history page may show 1.1kWh. Those figures describe different things. Mixing them up can make a healthy system look weak—or hide a limit that is cutting off useful solar power.
There is no universal “good daily number.” A small panel keeping a freezer cold has a different job from a roof full of modules supplying a house. Even two identical systems can record different results on the same day because one is shaded, one has a full battery, or one has more appliances running.
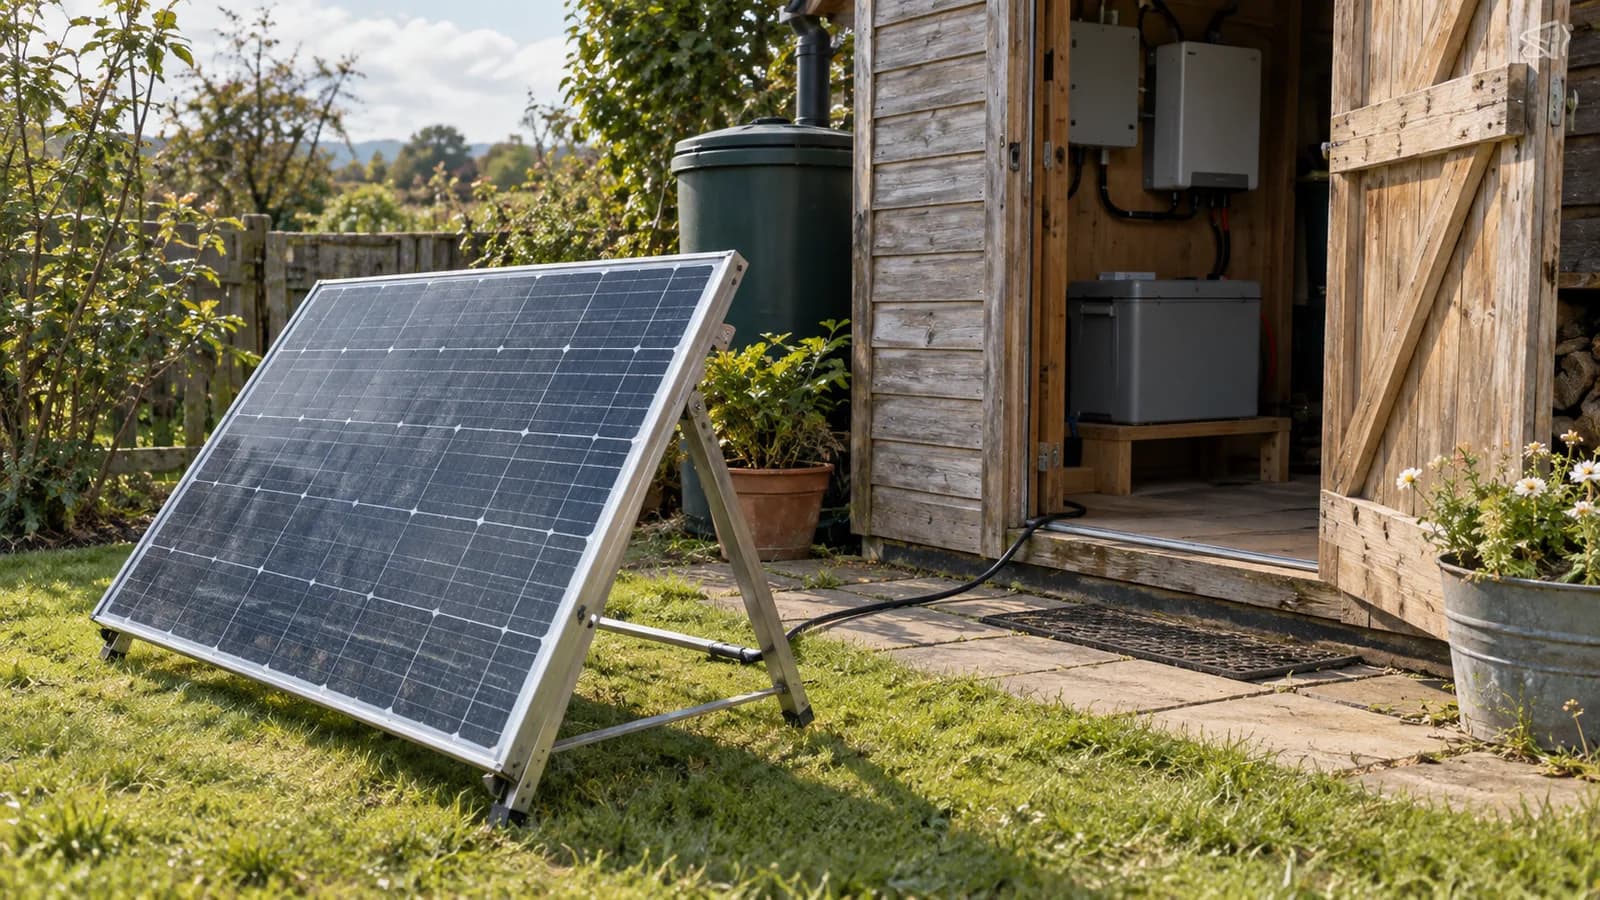
You do not need to be an engineer to make a useful first check. Start with four items: the total panel rating, the energy collected over the day, the highest power reached and what the battery and loads were doing. This guide explains how those pieces fit together. The photographs are illustrative editorial scenes, not customer installations. Any equipment change still needs to follow the exact product instructions and be reviewed by the responsible qualified person.
Read the label beside the number
Solar monitoring screens often place several similar-looking figures next to each other. The unit tells you what each figure means.
Watts show power at one moment. The value rises and falls as clouds pass, the panel heats up or the battery changes its charging state. Watt-hours and kilowatt-hours add that power over time. They tell you how much energy moved through the controller during the day. One kilowatt-hour is 1,000 watt-hours.
Victron's monitoring guide, for example, lists Solar Yield and Solar Pmax separately. Yield is the energy converted that day. Pmax is the highest solar power recorded that day. A strong Pmax does not guarantee a strong daily yield, and a modest Pmax can still produce useful energy if it continues for many hours.
- Screen value
- PV power — W
- What it tells you
- Solar power at that moment
- What it cannot tell you alone
- The day's total energy
- Screen value
- Pmax — W
- What it tells you
- The highest recorded power that day
- What it cannot tell you alone
- How long the system stayed near that level
- Screen value
- Daily yield — Wh or kWh
- What it tells you
- Energy converted during the day
- What it cannot tell you alone
- Whether that energy stayed in the battery or was used immediately
- Screen value
- Battery level — %
- What it tells you
- An estimate of the battery's remaining charge
- What it cannot tell you alone
- Total solar production or exact battery health
| Screen value | What it tells you | What it cannot tell you alone |
|---|---|---|
| PV power — W | Solar power at that moment | The day's total energy |
| Pmax — W | The highest recorded power that day | How long the system stayed near that level |
| Daily yield — Wh or kWh | Energy converted during the day | Whether that energy stayed in the battery or was used immediately |
| Battery level — % | An estimate of the battery's remaining charge | Total solar production or exact battery health |
Before comparing screenshots, check that both apps are showing the same unit and the same time period.
A daily kWh number needs something to compare with
The quickest check is to divide the day's solar energy by the installed panel capacity. Convert the panel rating to kilowatts first.
Suppose a small system has 300W of panels, which is 0.3kW, and the controller records 1.05kWh for the day. Divide 1.05 by 0.3 and the result is 3.5. In plain language, the panels delivered the same energy as running at their full 300W rating for three and a half hours.
This does not mean the sun was out for only three and a half hours. Real solar output makes a curve: low in the morning, stronger near the middle of the day, then lower again. The calculation simply gives you a fairer way to compare systems of different sizes.
The same 1.05kWh could be a reasonable day for a small array and a disappointing day for a much larger one. It might also be perfectly normal on a cloudy day. That is why the panel total, location, season and weather must stay beside the daily result. Any number used in this example is for teaching, not a promised yield.
The charge controller may set the ceiling
A solar charge controller has limits of its own. Adding panel wattage does not guarantee that all of it can reach a 12V battery.
Take a commonly used 15A MPPT controller as an example. Victron lists a maximum battery current of 15A for its 100/15 model and a nominal PV power of 220W on a 12V battery system. During charging, a battery voltage around 14V multiplied by 15A is roughly 210W. A graph that repeatedly flattens around that level in strong sun may be showing the controller limit, not the limit of the panels.
Do not judge the controller by one midday reading. Look for the same flat top on several clear days and compare it with the exact manual. Also check whether the battery was already nearly full. A controller will reduce power when the battery cannot accept more energy.
A larger controller only helps when more panel power is genuinely available and the battery, equipment and complete design can use it safely. The panel open-circuit voltage, operating current, cold-weather voltage, battery charging limit, cables and protection still have to fit the proposed equipment. Those checks belong in the product documentation and final electrical review, not in a guess based on wattage alone.
A full battery can make good panels look quiet
In a battery-based system, the controller does not always take every watt the panels could make. Once the battery reaches its charging target, the controller moves into a gentler charging stage. If the live loads are small, solar output falls because there is nowhere useful for the extra energy to go.
This creates a common misunderstanding. Someone sees low afternoon power and assumes the panel has stopped working well. The battery may simply have reached full charge before lunch. The charging history helps here: time spent in bulk, absorption and float tells a more complete story than the final kWh number.
Loads change the picture again. A freezer, fan or television can use solar energy while the battery is charging. The controller's daily yield can include energy that went straight to those loads, while the battery percentage shows only what remained stored. Record the battery level near sunrise and again after sunset, but also write down the equipment that ran during the day.
Battery capacity is another separate number. A nominal 12V 200Ah battery is about 2.4kWh before usable-capacity limits and losses are considered. Collecting 1kWh does not automatically add 1kWh to the battery if appliances were running, the battery began almost full or its charging settings reduced the input.
Weather and panel position still matter
A temporary panel leaning against a wall can be useful for testing, but its best hour may be quite short. A panel facing the morning sun may start early and then miss stronger light later. Nearby branches, a roof edge or even a narrow pole can reduce output for part of the day.
There is no direction that is best everywhere. The useful direction depends on the hemisphere, site, shade and when the energy is needed. Panel angle matters too, and the most useful angle can change with the season. That is why “five sun hours a day” should not be treated as a rule for every address.
Clouds are the obvious cause of a weak day, but heat, dirt and changing shade can also lower output. Compare like with like. A clear autumn day should not be judged against the best summer record. If output suddenly falls on similar clear days, check the monitoring errors and arrange a safe inspection for new shade, heavy soiling, physical damage or an equipment problem. Do not open live electrical equipment to investigate.
Use a week of history before buying more hardware
One day's result is a clue. A week or a month shows the pattern.
VictronConnect can show up to 30 days of solar yield, Pmax, battery voltage, charging stages and recorded errors. Other monitoring platforms provide similar history. Save enough information to see whether low production follows cloudy weather, whether power repeatedly stops at the same ceiling and whether the battery reaches full charge.
Then compare the trend with a location-based estimate. NREL's PVWatts uses array size, direction, tilt, weather data and system-loss assumptions to estimate PV production around the world. It models grid-connected systems, so a small battery setup may collect less energy when its battery is full or its controller is limiting power. Use the estimate as a reference for available solar energy, not as a promise for a particular day.
The pattern usually points toward the next question. A battery that reaches full early may need more daytime use or storage headroom, not more panels. A graph pinned to the controller ceiling may justify a model-level controller review. A system that never recovers the battery during ordinary weather may need more usable solar input, lower loads or both. A sudden drop compared with similar days calls for fault and site checks.
- 1
Battery reaches full early
Low afternoon power may be normal because the system has nowhere to put more energy.
- 2
Power sits at one flat ceiling
Compare that ceiling with the exact controller's current and power limits.
- 3
Battery rarely recovers
Compare daily loads with usable solar energy across ordinary and poor-weather days.
- 4
Output suddenly changes
Review errors and arrange a safe check for new shade, dirt, damage or equipment faults.
Keep these details with the daily result
A useful solar-output question needs more than a screenshot. Collect the short list below before deciding that the panels, controller or battery need replacing. It gives an installer or supplier enough context to separate normal variation from a real limit.
- Exact panel model, quantity and total rated watts.
- General location, season, weather and whether the day was typical.
- Panel direction, angle, temporary or permanent mounting, and known shade during the day.
- Seven to 30 days of yield, Pmax, charging-stage and error history where available.
- Exact controller model plus battery voltage, chemistry, capacity and permitted charging current.
- Battery level near the start and end of the day, along with the main loads and when they ran.
How many kWh should a solar panel produce per day?
There is no fixed daily figure for one panel. Start with its rated watts, then account for location, season, weather, direction, shade, temperature and system limits. Divide measured daily kWh by the array size in kW to compare one day or system more fairly, and use a location-based estimate as a reference rather than a guarantee.
Why does solar power stop rising even in bright sun?
The charge controller may have reached its output-current limit, the inverter may be limiting power, or the battery may be nearly full and asking for less charge. A repeated flat top across several clear days is more useful evidence than one live reading. Compare it with the exact equipment documentation and charging history.
Will a bigger charge controller always increase daily solar yield?
No. It can help when the existing controller is the real bottleneck and the panels have more usable power available. It will not create more sunlight, correct shade or increase a full battery's need for energy. The replacement must also fit the panel voltage and current, battery charging limits and complete electrical design.
Related Articles
Solar solutions for telecom towers, schools and clinics with unreliable grids
A classroom, a telecom station and a clinic need different backup plans. Start with the equipment that must keep working, then build the solar supply around it.
Read Article→
What does a one-stop solar system supplier actually provide?
Need panels, an inverter, batteries and the parts to put them together? Here is how Rongkai helps turn a project requirement into a coordinated supply package.
Read Article→
How do solar panels perform in clouds, heat, salt air and dust?
A panel's watt rating cannot describe every site. Learn what changes in cloudy, hot, coastal and dusty locations, and which details belong in a supply quote.
Read Article→