
Why is my home battery low every morning?
A low morning reading does not prove the battery is too small. First find out how full it was at bedtime and where the energy went overnight.
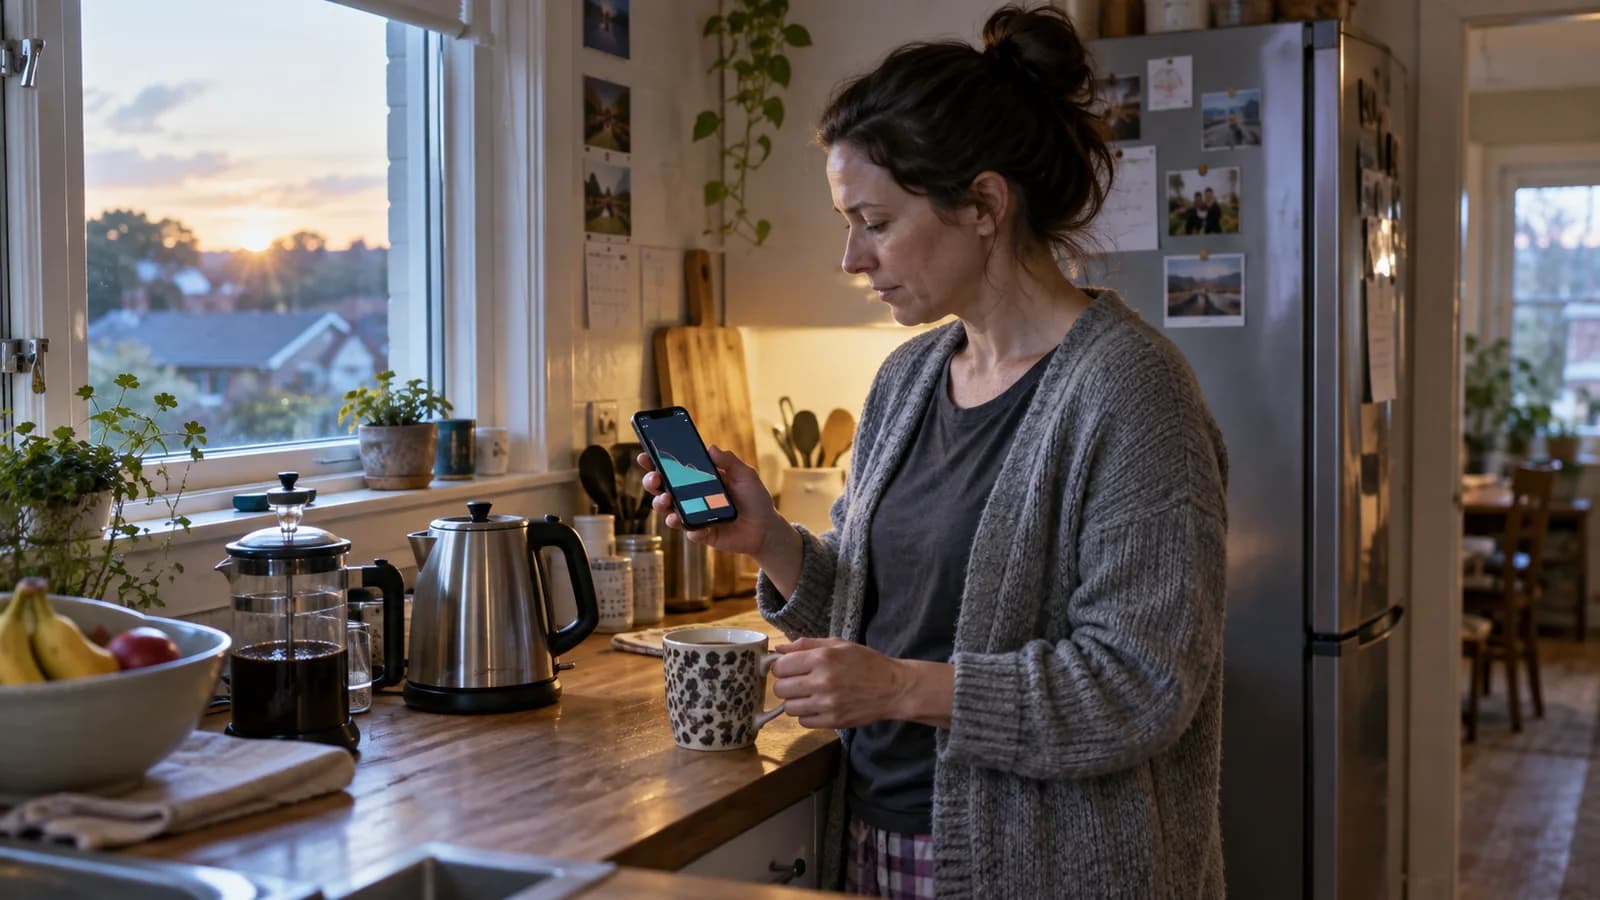
The battery app shows 20% at breakfast. Before buying another module, check the reading from bedtime. A battery that began at 55% had a very different night from one that began at 95%, even if both finished on the same number.
Sometimes the battery simply did not charge fully the day before. On another night, a water heater, heat pump or EV may account for the missing energy. The system may also be stopping at its backup reserve, and an app without a complete home meter can leave part of the picture out. Adding capacity helps only when the existing battery is genuinely running short on a known load.
Compare the same bedtime-to-morning hours over several nights. Write down the state of charge, discharged energy, home use, grid flow and any large appliances that ran. Then look back at the previous day's solar production. This is a monitoring guide, not an electrical installation guide; a meter or sensor that requires work inside a switchboard belongs with a qualified installer.
Check how much charge was there at bedtime
If the battery began the night at 95% and reached its 20% reserve before breakfast, it supplied far more stored energy than a battery that began at 55% and finished at the same 20%.
Read the percentage together with the energy in kWh. State of charge estimates how full the battery is; the discharge figure shows how much energy the system says it delivered. Write down the reserve setting too. If the controls are set to stop at 20%, stopping there is expected behaviour.
Check whether anything charged it after bedtime. A low-price grid schedule, generator or another source can make the percentage rise during the night. That energy belongs in the record; otherwise the apparent overnight consumption will not add up. Also note a grid outage, a changed operating mode or a temporary backup setting, because each can alter how the battery behaves.
Compare the same hours for a week
Choose a start time after useful solar production has ended and an end time before morning solar has made a meaningful contribution. The exact clock times will move with the season. Consistency matters more than choosing a universal 10 p.m. to 6 a.m. window.
Seven ordinary nights are a useful first sample, not a technical rule. Include weekdays and a weekend if the household routine changes. Mark nights with guests, laundry, EV charging, unusual heating or cooling, or a power cut instead of quietly averaging them into the rest. If weather strongly affects heating or cooling, repeat the check in another season before treating one mild week as the household's normal pattern.
Screenshots can work for a quick review. A CSV export is better when the app offers one because timestamps can be compared without reading values from a small graph. Tesla, for example, documents day-to-lifetime energy views, component flows and downloadable data; systems with Powerwall can include charge-level data at 15-minute intervals. Victron's VRM documentation likewise describes historical production and consumption data with a state-of-charge line when the required devices and meters are present. Other platforms expose different fields, so use the manual for the installed system.
- Start and end time for the overnight window.
- Battery state of charge at both times, plus the minimum reserve setting.
- Battery energy discharged and any energy charged during the window.
- Household energy use and grid import during the same hours.
- Large loads and their approximate start and stop times.
- Previous-day solar production, battery state before sunset and any solar exported or curtailed.
Start with the data your system already records
Start with the inverter or battery portal. A well-metered system may already show solar production, home consumption, grid import and export, battery power and state of charge on one timeline. Do not assume every installation has all of those measurements. Some apps can show solar generation but cannot see the whole home's load because the necessary site meter was not fitted or configured.
Utility or smart-meter interval data gives a useful cross-check for grid import. It will not normally explain which appliance used the energy. If the whole-house graph shows a steady unexplained load, move down to individual plug-in appliances.
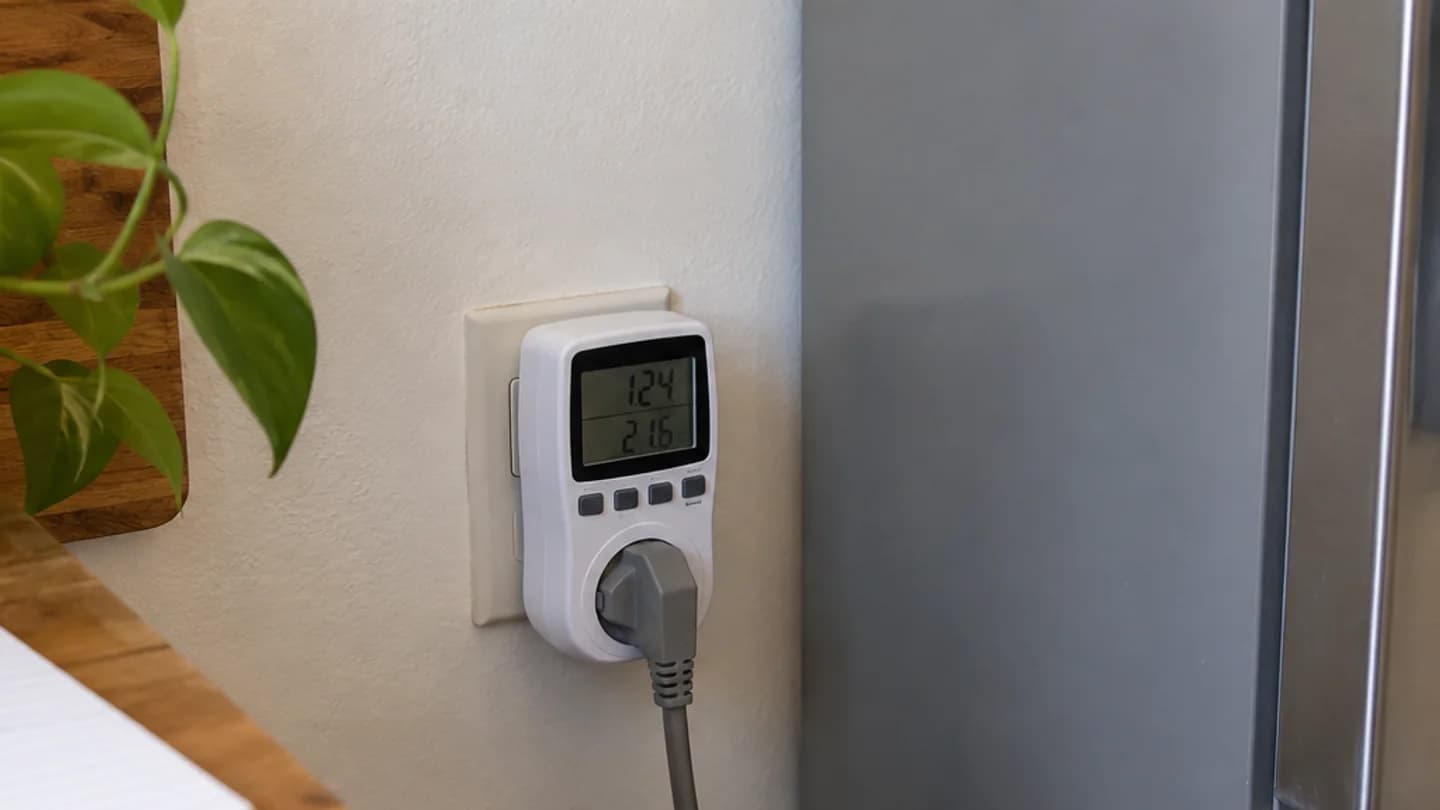
A suitable plug-in energy meter can measure a refrigerator, freezer, dehumidifier or other compatible cord-and-plug load. Leave it connected long enough to catch normal cycling—at least a full day is more useful than watching the screen for ten minutes. A refrigerator's compressor switches on and off, so its running watts at breakfast are not its daily energy use. Plug-in meters are not for hardwired equipment or loads beyond their stated rating.
Whole-house monitors can reveal hardwired loads and shorter peaks. Products that use current transformers or other equipment inside the electrical panel require the correct design and installation. Do not open a live switchboard to reproduce an online monitoring example.
Two sample nights that both ended at 20%
These are invented log entries with rounded figures. They show how to read the record and are not a customer case or a household benchmark.
On the first night, the battery began nearly full and delivered 6.5kWh before reaching its reserve. The water heater accounted for much of the extra overnight use. Another module could carry that load, but the homeowner should first check why the heater ran then and whether its schedule can move.
The second night used less energy. A cloudy day had left the battery at 62% by bedtime, so it reached the same 20% reserve after delivering only 3.6kWh. The next check is the daytime solar and charging graph; increasing capacity would not make that battery start the night fuller.
- Fictional overnight log
- Battery at bedtime
- Night A
- 95%
- Night B
- 62%
- Fictional overnight log
- Battery in the morning
- Night A
- 20% reserve
- Night B
- 20% reserve
- Fictional overnight log
- Battery energy discharged
- Night A
- 6.5kWh
- Night B
- 3.6kWh
- Fictional overnight log
- Home use during the window
- Night A
- 8.2kWh
- Night B
- 4.1kWh
- Fictional overnight log
- What stands out
- Night A
- Water heater ran overnight
- Night B
- Battery was not full before sunset
- Fictional overnight log
- Next place to look
- Night A
- The water-heating schedule and measured use
- Night B
- Daytime solar production and battery charging
| Fictional overnight log | Night A | Night B |
|---|---|---|
| Battery at bedtime | 95% | 62% |
| Battery in the morning | 20% reserve | 20% reserve |
| Battery energy discharged | 6.5kWh | 3.6kWh |
| Home use during the window | 8.2kWh | 4.1kWh |
| What stands out | Water heater ran overnight | Battery was not full before sunset |
| Next place to look | The water-heating schedule and measured use | Daytime solar production and battery charging |
The morning number is the same. The bedtime charge and overnight kWh show why it happened.
Follow the first change in the graph
Daily totals can hide the useful clue. Zoom in on the overnight graph and find the first clear rise in household demand. A steady background load of a few hundred watts is a different problem from a large block that begins at 2 a.m. The second pattern gives you a time to match against hot water, heating, EV charging, laundry or a pump.
If the battery starts close to full, reaches reserve on ordinary nights and delivers roughly the same kWh each time, capacity may be the shortfall. Confirm that the load is real and cannot sensibly be moved before pricing another module.
If the battery often starts below its target, move back to the previous afternoon. Check solar production, grid-charging windows, charge-power limits and the selected operating mode. If the battery remains partly charged while solar is exported, ask why it did not accept the energy; settings, temperature, compatibility or another system limit may be involved.
Occasional drops usually have an occasional cause. Match the timestamp to what happened in the house that night. If state of charge falls sharply but the recorded discharged energy is small, the measurements may not cover the same equipment or time period. Save the graphs and ask the installer or manufacturer support channel what each value includes rather than trying to make mismatched figures balance.
Check whether an extra module can be filled
Extra capacity helps when the existing battery regularly starts the night near its target, reaches reserve during a useful period and leaves the home buying energy that the larger battery could have supplied. Even then, the added module needs a charging source.
Look at days when the present battery reached full. Was solar still being exported or curtailed afterwards? How much, and in which months? If very little spare solar exists, decide whether a low-price grid window can fill the larger battery within the allowed charging power. More capacity cannot fix a short charging window or an inverter that remains the bottleneck.
The final check is whether the household can use the extra energy. A larger battery that finishes most mornings well above reserve may add little daily value. Backup can still justify it, but name the loads and extra hours rather than calling all unused capacity a saving.
Once the overnight record points to a genuine capacity shortfall, compare the next module against the exact battery family, inverter limit, usable-energy increase, permitted expansion route and installed cost. That is the point to move from diagnosis to an expansion decision.
Does a low morning state of charge mean my home battery is too small?
No. It may have started the night partly charged, supplied an unusually large load, stopped at its reserve or be shown through incomplete monitoring. Compare the same overnight window for several nights and include discharged kWh, home use and grid flow before blaming capacity.
How many nights should I monitor?
A week of ordinary nights is a practical starting point, especially if it includes both weekdays and a weekend. Mark unusual weather, guests, EV charging and heavy appliance use. Repeat the check in another season when heating or cooling changes the household load significantly.
How long should I measure a refrigerator?
Use a suitable plug-in energy meter for at least a full day so it captures normal compressor cycling. Longer is better when room temperature, door opening or defrost cycles vary. Follow the meter and appliance ratings, and do not use a plug-in meter for hardwired equipment.
Should I add more solar panels or more battery capacity?
If the battery often begins the night undercharged, more storage alone does not create energy. Check whether the site lacks solar production, has unused solar that the battery cannot accept, or has another charging window. If the battery starts full and repeatedly runs short on a confirmed load, additional usable capacity may help.
Related Articles
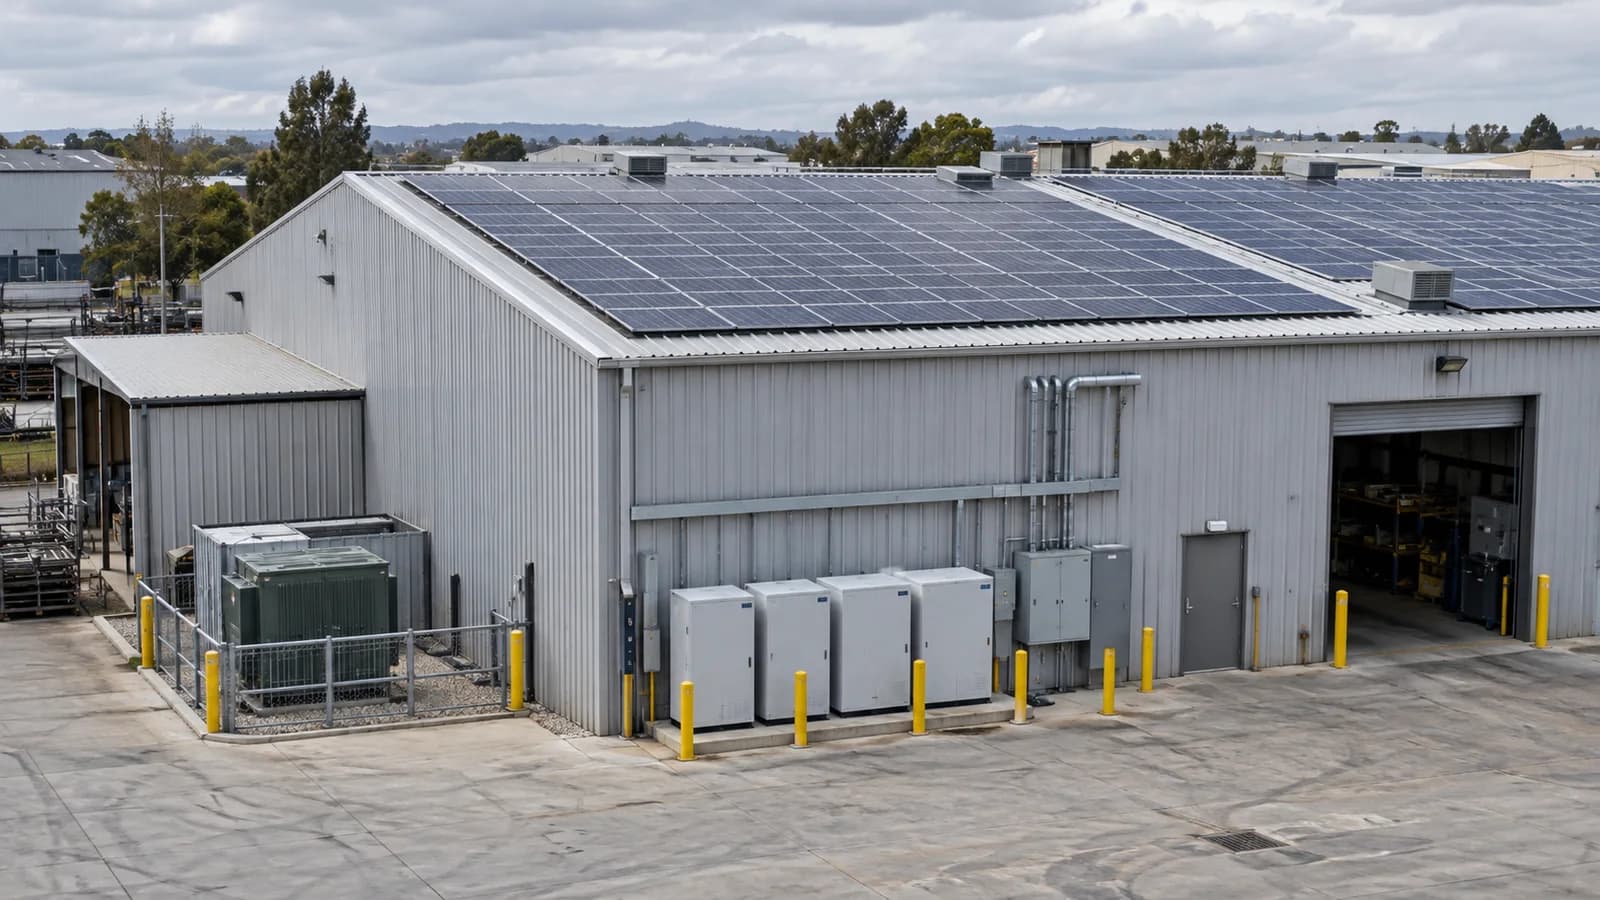
How to plan a commercial solar and battery storage system
Start with the load curve and electricity bill. They reveal far more about the right commercial battery than the building's monthly kWh.
Read Article→
Do solar panels cause roof leaks or damage your roof?
Solar panels do not normally make a sound roof leak. Problems are more often linked to roof condition, unsuitable mounting, damaged materials or poor workmanship.
Read Article→
How to size solar panels, a home battery and an EV charger for a villa
Size the panels for energy, the inverter for loads that run together, the battery for evening use and backup, and the charger for the car's daily refill.
Read Article→